Portfolio Diversification Analysis with PCA

Portfolio Diversification Analysis with PCA
If you are seeking to optimize portfolio hedging while generating returns, consider examining Flow Traders. Flow Traders (FLOW.AS) stands as a preeminent global market maker and proprietary trading entity, renowned for its provision of liquidity in the securities market through adept utilization of high-frequency and quantitative trading methodologies. Established in Amsterdam, Flow Traders maintains a prominent presence with offices situated in major financial centers including New York, London, Milan, Paris, Cluj, Singapore, and Hong Kong, offering investors a noteworthy 6% dividend yield.
Central to this proposition is the concept of liquidity. The hedge offered presents a strategic liquidity endeavor. Particularly in volatile markets, where there is a surge in selling pressure, entities such as Flow Traders stand to realize substantial gains through proficient spread management.
In this analysis, I will scrutinize a long-only stock ETF portfolio utilizing Principal Component Analysis (PCA) to assess its diversification effectiveness. Subsequently, leveraging these insights, I will demonstrate how the inclusion of FLOW can augment the portfolio’s diversification.
The initial portfolio comprises equally weighted positions across various ETFs, encompassing a diverse array of stocks spanning numerous geographical regions. These ETFs are enumerated below:
- iShares MSCI World Momentum Factor UCITS ETF – ISIN IE00BP3QZ825
- iShares MSCI EM UCITS ETF (Acc) – ISIN IE00B4L5YC18
- iShares MSCI EM Asia UCITS ETF (Acc) – ISIN IE00B5L8K969
- SPDR S&P US Dividend Aristocrats UCITS ETF – ISIN IE00B6YX5D40
- Vanguard FTSE All-World UCITS ETF (Acc) – ISIN IE00BK5BQT80
Although holding an ETF comprised of thousands of stocks might intuitively appear to provide adequate diversification to a portfolio, such an assumption may not hold true in practice. Utilizing Principal Component Analysis (PCA), I demonstrate that the aforementioned portfolio lacks proper diversification.
When referring to diversification, I am emphasizing the importance of the number of truly unrelated investments or risk drivers within the portfolio. Each risk factor must exhibit no correlation with all other risk factors in the portfolio. The greater the number of uncorrelated positions within the portfolio, the higher the degree of diversification.
According to PCA principles, principal components are uncorrelated, with eigenvectors being orthogonal to each other. We will calculate the loadings for each principal component and assess how each asset loads onto these components. Ideally, assets should heavily load onto different components to achieve optimal diversification. Additionally, I aim to maximize the number of principal components needed to explain approximately 75% of the variation in the portfolio.
Subsequently, I conduct a backtest of the portfolio, both pre and post PCA adjustments. The backtesting methodology involves monthly rebalancing of assets (equally weighted) during the testing period and accounts for transaction costs, inclusive of order fees and exchange fees (calculated as = Order Fees + 0.0025 × Dollar Amount + Exchange Fees).
For the analysis, price data spanning from July 2019 to February 2021 is utilized. This timeframe was selected due to the unavailability of pricing data for certain ETFs prior to July 2019. The pricing data can be sourced from msci.com and finance.yahoo.com.
The initial step in my analysis involved generating a correlation matrix to visualize the interrelationships among the monthly returns of all assets within my portfolio. This served as an initial exploration to gain insights into the behavior and correlations among my investments.
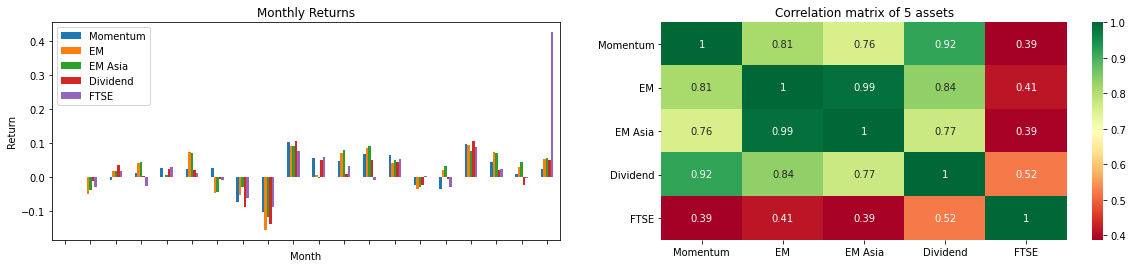
Upon analyzing the correlation matrix, it becomes apparent that certain holdings within my portfolio exhibit a notably high correlation, while FTSE appears to demonstrate lower correlation with the rest, signaling a positive attribute.
Subsequently, I proceeded by centering and scaling the prices of each investment or feature, followed by conducting Principal Component Analysis (PCA) on the standardized data. Standardization was essential as PCA aims to derive a feature subspace that maximizes variance along the axes, necessitating uniform scaling of the data. It’s important to note that although standardization ensures each feature’s variance becomes 1, there will still be directions (linear combinations of features) where variation differs, with directions exhibiting greater variation being selected.
Upon completion, the first two principal components encapsulated 97% of the dataset’s information. The first principal component elucidates 93% of the variance, while the second principal component encapsulates 4% of the variance. Subsequent components, namely the third and fourth, accounted for the remaining variance in the dataset. Notably, principal components are structured such that the first principal component captures the largest possible variance within the dataset.
| PC1 | PC2 | PC3 | PC4 | PC5 | |
|---|---|---|---|---|---|
| Variability | 93.13% | 4.06% | 1.83% | 0.89% | 0.08% |
| Cumulative | 93.13% | 97.19% | 99.03% | 99.92% | 100.00% |
To achieve a desirable level of relative diversification, it’s imperative to maximize the number of principal components necessary to explain approximately 75% of the variance in the portfolio, with a minimum threshold of three components. Upon plotting the loadings, it becomes evident that the majority of variables exhibit relatively heavy loading on the first component.
This observation underscores a potential imbalance in the diversification across principal components. To address this, it may be prudent to explore strategies to redistribute the loadings more evenly across multiple components. This could involve adjustments to the composition of the portfolio or employing techniques such as feature engineering to enhance diversification.
By optimizing the allocation of loadings across principal components, a more balanced and robust diversification strategy can be attained, mitigating concentration risk and enhancing portfolio resilience. Continued analysis and refinement of the PCA model will be instrumental in achieving the desired level of relative diversification and maximizing portfolio effectiveness.
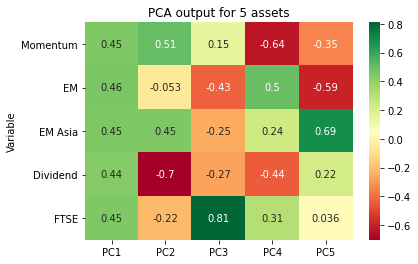
The observation that the first principal component serves as a proxy for equity risk suggests that the investments within the portfolio share a common risk factor. Given that the first principal component explains a substantial 93% of the variance, this finding is unsurprising. Additionally, it’s noted that EM, EM Asia, and FTSE load heavily on PC5 and PC3, respectively, indicating distinct risk exposures for these assets.
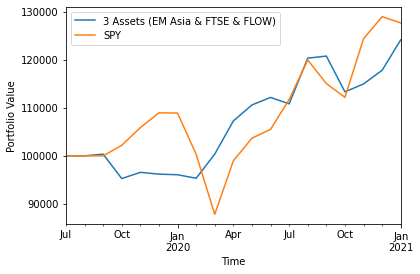
To proceed, let’s focus on two of these assets (omitting EM for now) and rebalance them monthly with equal weights. The resulting portfolio performance is as follows:
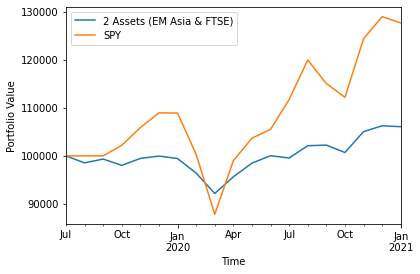
It is evident that when the benchmark (SPY) experiences a downturn, there is a notable parallel in the performance trajectory of my portfolio.
Let us explore the potential impact of hedging my positions by incorporating a position in FLOW. FLOW, known for its profitability during periods of heightened volatility, serves as a hedging instrument in my portfolio strategy. To assess the efficacy of this hedge, we will update the asset correlation matrix to include FLOW and examine how its inclusion influences the correlations among portfolio assets.
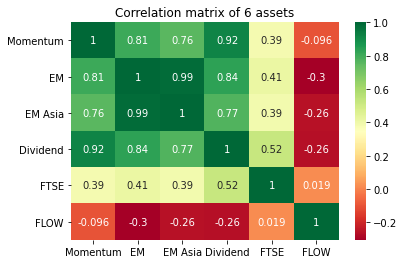
The initial examination of the correlation matrix reveals that FLOW exhibits low correlation with my existing investments, and notably, it demonstrates negative correlation with certain assets. This suggests that FLOW may serve as an effective diversification tool within my portfolio, offering potential benefits in mitigating overall risk exposure.
Given this observation, let us proceed with conducting Principal Component Analysis (PCA) to further explore the diversification potential and risk management implications of incorporating FLOW. By analyzing the principal components, we can gain insights into how FLOW interacts with other assets and assess its impact on portfolio risk and performance.
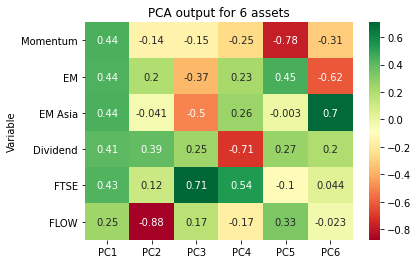
It is encouraging to observe that FLOW does not load onto the same components as the rest of my investments, indicating its potential as a distinct and uncorrelated asset within the portfolio. This diversification benefit underscores the importance of incorporating FLOW as a risk management tool.
With this insight in mind, let us proceed with simulating trading activities. By incorporating FLOW into the portfolio and analyzing its impact on trading dynamics, we can assess how this strategic addition influences overall portfolio performance and risk characteristics.
Indeed, the observed behavior of FLOW during market downturns, where it acts to buoy my portfolio, underscores its efficacy as a hedge. Moreover, the additional benefit of receiving dividends while holding FLOW further enhances its appeal as a risk management instrument.
Furthermore, FLOW presents a compelling growth narrative, particularly in volatile market conditions where increased trading activity generates substantial profit opportunities. As market volatility escalates and investors resort to panic selling, entities like Flow Traders stand to capitalize on widened spreads, thereby bolstering their profitability.
Considering these factors, FLOW emerges as a viable option for investors seeking a reliable hedge against market volatility, coupled with the potential for dividend income and growth. Its unique ability to thrive in turbulent market environments makes it a noteworthy consideration for inclusion in one’s investment strategy.